LINDA KASTRUP/RITZAU SCANPIX, 2015
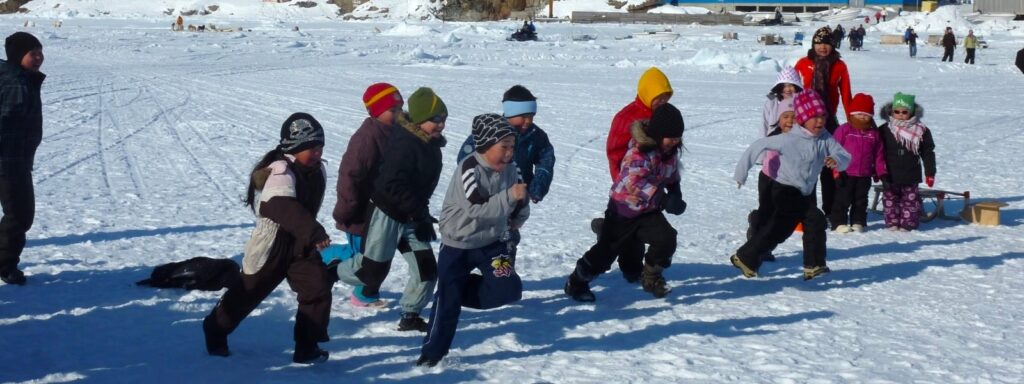
The Greenlandic Inuit, the indigenous people of Greenland, commonly call themselves Kalaallite, Greenlanders, and the country Kalaallit Nunaat, the land of Greenlanders. The Greenlandic Inuit are one of the few indigenous peoples in the world who are the majority population in their own country.
Greenlanders were granted Danish citizenship in 1926, and therefore the terms ‘born in Greenland’ and ‘born outside Greenland’ are used in official statistics to distinguish between ‘Greenlanders’ and ‘Danes’. Greenland’s Statistics 1994 Survey of Greenlandic Living Conditions showed that the vast majority of people ‘born in Greenland’ perceived themselves as Greenlanders and that most people ‘born outside Greenland’ perceived themselves as Danes.
Size and settlement of the population – distribution by settlements
LIFE PICTURE COLLECTION/SHUTTERSTOCK/
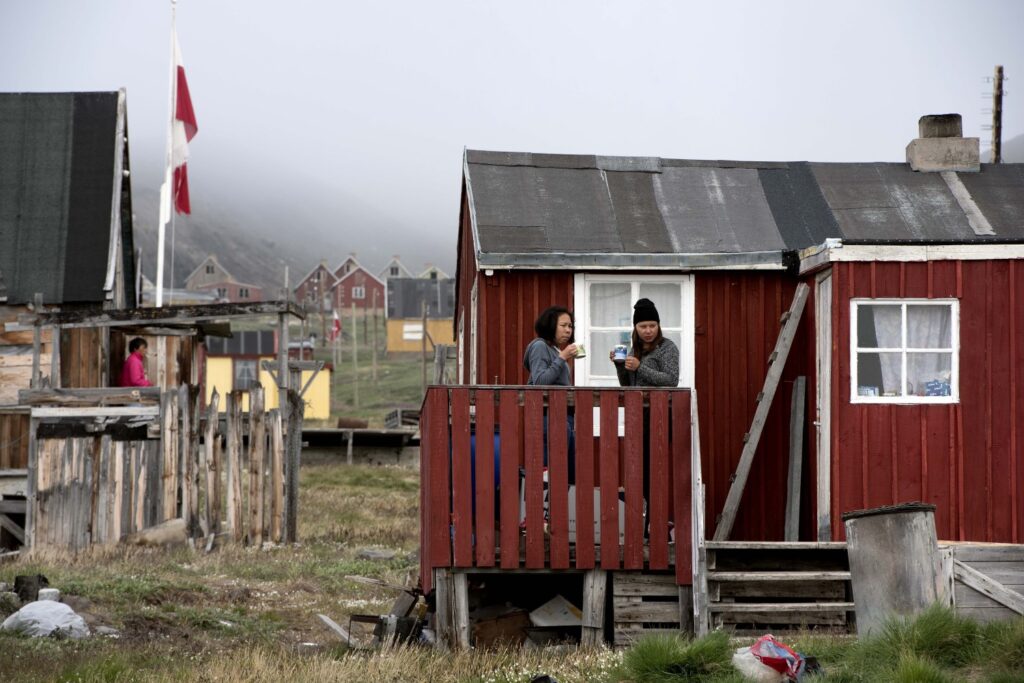
Greenland is not only the world’s largest island, but it also consists of many settlements that can be characterised as insular communities consisting of 17 towns and 54 settlements, as well as sheep farms and stations.
The traditional way of life among the Greenlandic Inuit when the colonisation of Greenland and the mission activities began was semi-nomadic, originating in a permanent winter settlement and changing summer settlements depending on the prevalence of game and fish. Both the trade (Royal Greenland Trading Department, KGH) and the mission had an interest in the population becoming more permanent residents. The number of settlements increased, partly due to an increasing population, up to the early 1900s, but has since been declining. The population in the towns (term from 1721: ‘colonies’) has been increasing from the 18th century, and, in the early 1950s, it exceeded the population ‘outside the towns’. The term ‘outside the towns’ is a collective term for ‘settlements’, which make up by far the largest part of the group as well as the sheep farms in South Greenland and stations.
The overall political objectives stated in the government plans from the 1950s and 1960s to modernise Greenland, the so-called G-50 and G-60 plans, were, among other things, to improve of the living standards of the Greenland population and a commercial focus on cod fisheries by, e.g., establishing fish factories in a few selected towns on the west coast. The modernisation plans built on a premise that both welfare improvements and the realisation of economies of scale in the fishing industry necessitated a population concentration in substantially fewer inhabited areas.
The concentration policy involved the depopulation and thus relocation from many settlements, including the mining town of Qullissat (1972). This policy met a great deal of local resistance and became one of the driving forces of the political movement towards Greenlandic autonomy. The conditions of the settlements (e.g., the establishment of factory plants) were therefore improved in the period following the introduction of the Home Rule. The population in the settlements stabilised in the 1980s, while migration from settlements (and a number of smaller towns) took off after the turn of the millennium, not least following a number of political initiatives such as the elimination of the same-price system for retail goods (1994) and energy and water taxes (2005). The same-price system on energy and water was reintroduced in 2018.
The population in Greenland has been increasing since the 1901 census and until 1991, when the Greenlandic population figure had reached 55,520. Since the early 1990s, the year-to-year population has changed only slightly in an upward or downward direction and was 56,421 in 2021. The highest population figure to date was 56,969 in 2005.
While the overall population has remained relatively stable over the past 30 years, there have been more significant shifts in the proportions of individual population groups, and a comparison with the development in the size and composition of the population from the beginning of the 20th century also shows substantially greater changes.
Accordingly, in the first half of the 20th century, the population had doubled to 23,647 by 1951, and doubled again by 1971 to reach 47,935. There are several reasons for these significant changes: an improved state of health (including the eradication of tuberculosis), a reduction in infant mortality, an increase in fertility and immigration of mainly Danish labour.
Size of population and distribution by age groups

GRØNLANDS STATISTIK – STATISTIKBANKEN/BEXSTA
In the 1960s, twice as many children per year group were born compared with the year groups ten years before and ten years after. This is why the year groups born in the 1960s are called ‘the large year groups«.
The number of live births reached the highest in 1966 when 1,781 children were born. In order to limit population growth, the Danish Ministry for Greenland and the Danish Health encouraged the use of intrauterine devices (IUD) in fertile Greenland women. In the period 1966‑1970, 4,500 IUDs were fitted.
When the IUD campaign started, there was no legal basis to fit IUDs in underage girls without parental consent. Legislation was changed in 1970 so that doctors in Greenland could guide young girls from the age of 15 on contraception without the consent of their parents. At a UN conference in 1974, harsh criticism was voiced over family planning in previously colonised countries such as Greenland, and the UN called for everyone to be allowed to decide how many children they want and when.

GRØNLANDS STATISTIK – STATISTIKBANKEN/BEXSTA
In 1975, barely 10 years after the number of live births peaked and after the IUD campaign was carried out, the birth rate was 815, thus a decline of more than 50 %.
The increasing numbers in the groups 17 to 24-year-olds and 25 to 64-year-olds up through the 1980s are, among other things, the large year groups that have become young people and adults, just as the growing number of 0 to 6-year-olds in the 1980s and 1990s are children of the large year groups. They are therefore what can be called an echo effect. Citizens aged 65 and over represent the smallest age group throughout the period, but it is slightly increasing, especially in the latter part of the period. As a result of increasing life expectancy, the size of the group has tripled overall in the almost 40 years.
Size and distribution of population by gender

DANMARKS STATISTIK & GRØNLANDS STATISTIK – STATISTIKBANKEN/BEXSTA
Until 1961, women made up the largest group of the Greenland population. This was primarily due Greenlandic men dying while hunting or fishing. The preponderance of women had narrowed by 1960, partly due to fewer deaths at sea. The main reason why men have made up a majority of the population since 1961 is the large number of posted Danish workers (typically single men) and later the group of on-call workers. A majority of the workers who migrated to Greenland were and still are single. At the same time, over the past 25 years (since 1993), there has been a net emigration of women born in Greenland of around 200 annually.
Greenlandic societal development is often described as both rapid and profound, and population trends reflect this development.
The gender distribution among the working population has changed significantly, while the total number of people employed in the period 1965 to 2001 doubled. While 76 % of all employed people in 1965 were men, the proportion fell to 67 % in 1974 and 1987 and further to 54 % in 2001. Over the past decade, the distribution has been more stable and the proportion of men has been between 54 % and 56 %.
Labour market attachment, the participation rate, has been slightly higher in the period from 2010 to 2018 for men than for women, but it has remained stable for both genders. For men, it has been 76‑77 % and for women 71‑72 %.
Women’s attachment to the labour market has not only increased, they increasingly complete educational programmes at all levels. Accordingly, in all the years since 2003, more women than men have graduated from a higher education. The level of education is generally increasing, and by 2019 a greater proportion of women had completed an education programme above primary school level.
The size and distribution of population by place of birth

STATSMINISTERIETS GRØNLANDSAFDELING, DANMARKS STATISTIK OG GRØNLANDS STATISTIK – STATISTIKBANKEN/BEXST1
GRØNLANDS STATISTIK – STATISTIKBANKEN/BEDST9A
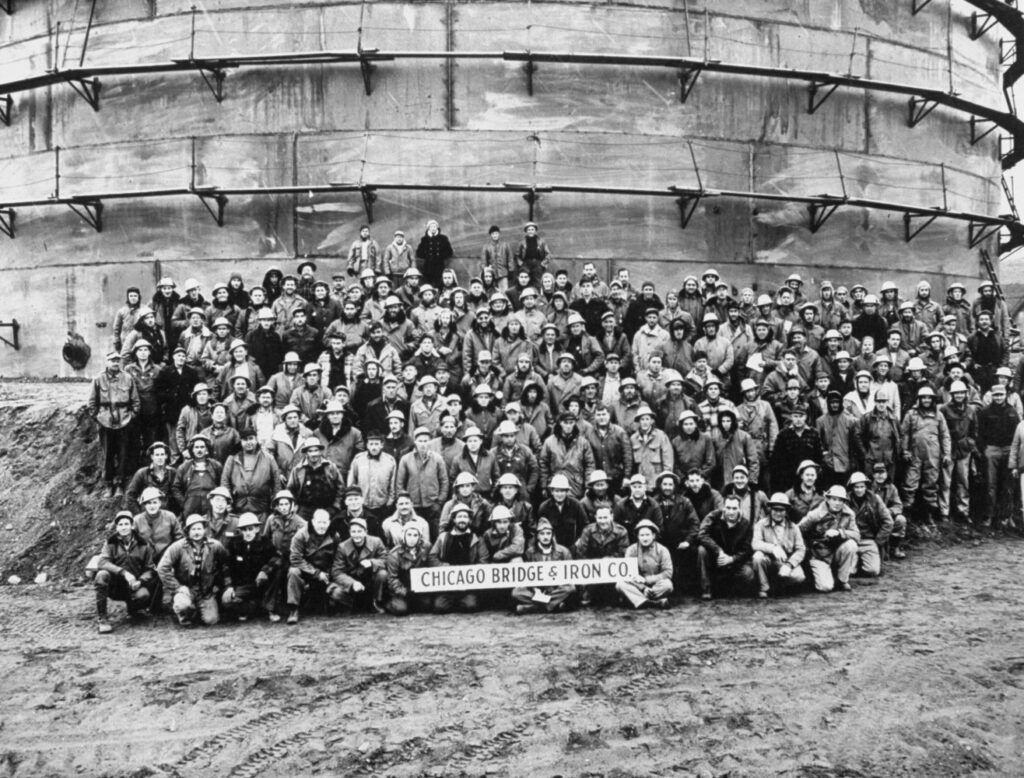
The increase in the population of both persons born in and outside Greenland was exponential in the period 1951‑61. For the Greenlandic part of the population this was due to e.g. improved health conditions and increased fertility. For the people from outside Greenland, typically Danes, this was due to the need for construction workers, craftsmen, technicians and administrators. Since the basic view of Danish planners and politicians in relation to carrying out these tasks was that the need for labour would be short-lived, the Danish State skilled as well as unskilled labour to undertake the various parts of the modernisation process, while training local labour was not part of the plans.
However, the scope of external labour did not diminish, neither during the modernisation period nor after the introduction of Home Rule Government in 1979. The pace at which the Home Rule Government took over areas of responsibility from the Danish state was much faster than expected. Since it was not possible to train Greenlanders to take on jobs immediately in the areas that were taken over, it was therefore often necessary to call in labour with the necessary qualifications in order to solve the many new tasks, which increasingly included tasks in the municipalities’ and the Home Rule Government’s (later Self-Government) administrations, service sectors (education, health and social services) and the publicly owned companies.
The number of inhabitants born outside Greenland peaked at almost 10,000 in the late 1980s. During those years, Home Rule was in a deep economic crisis that led to a reduction in the number of called-in labour. Since then, both the proportion of the population born outside Greenland and the number of immigrants have been declining, and in 2020 it was just about 6,000.
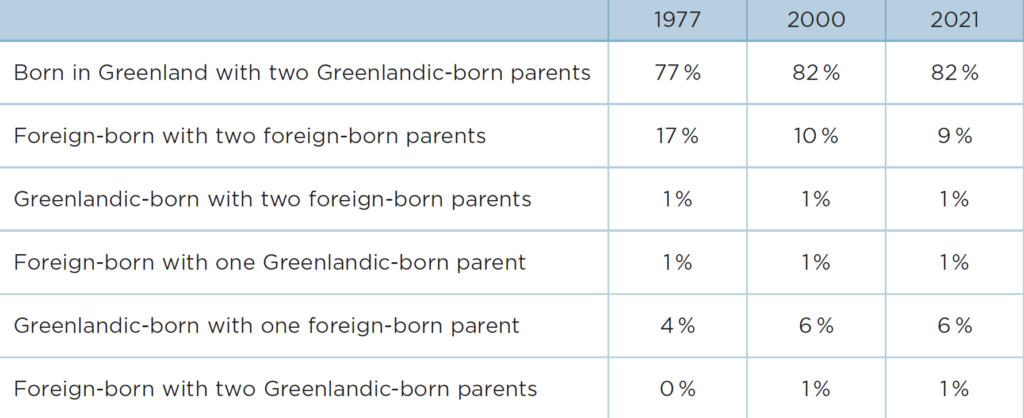
In order to get a more differentiated picture of the population composition than the division of ‘born in Greenland’ and ‘born outside Greenland’, for the period 1977 onwards, Statistics Greenland has included the birthplace of parents and grandparents in addition to the person’s own place of birth. For each combination option, a basic code is determined.
The group of people born in Greenland having two Greenland-born parents is the most frequently occurring. The group counts between 46,000 and 47,000, representing about 82 % of the population. The proportion of people born outside Greenland (typically in Denmark) whose parents were also born outside Greenland (also typically in Denmark) has been reduced by more than 40 %.
Population trends – the population accounts
How the overall population number develops, i.e. population growth, depends on four conditions: the number of births and deaths, and the number of immigrants and emigrants. The difference between births and deaths is referred to as excess of births, and the difference between the emigrants and immigrants is called the net immigration.
Over the past 70 years, the Greenlandic population accounts have had a positive balance, i.e. a population increase, for most years.
The excess of births was highest in the 1960s when the so-called ‘large year groups´ were born. The years and short periods in which the total population has been in decline coincide with a positive net emigration, that is, a period in which emigration has been greater than immigration. This happened, for example, in the years before the introduction of Home Rule Government, in the period around 1990 and again in the period from 2005 to 2015. People born in Greenland typically emigrate to Denmark, and the number of Greenland- born people in Denmark was around 16,770 in 2020 (up by almost 2,400 since 2009).
There has been an excess of births in all the years since 1950, although due to declining fertility rates, it has been declining since the late 1980s. The fertility rate in 2019 was 2.08 children per woman between the ages of 15 and 49. The declining fertility rate is not least due to a high number of legal abortions. In the period 1993 to 2019, the annual abortion rate was between 740 and 1,000, while during the same period the number of births varied between 780 and 1,180. In the period since 2013, the number of legal abortions each year has exceeded the number of births.

STATSMINISTERIETS GRØNLANDSAFDELING, DANMARKS STATISTIK OG GRØNLANDS STATISTIK – STATISTIKBANKEN
Causes of death
PETER BJERREGAARD
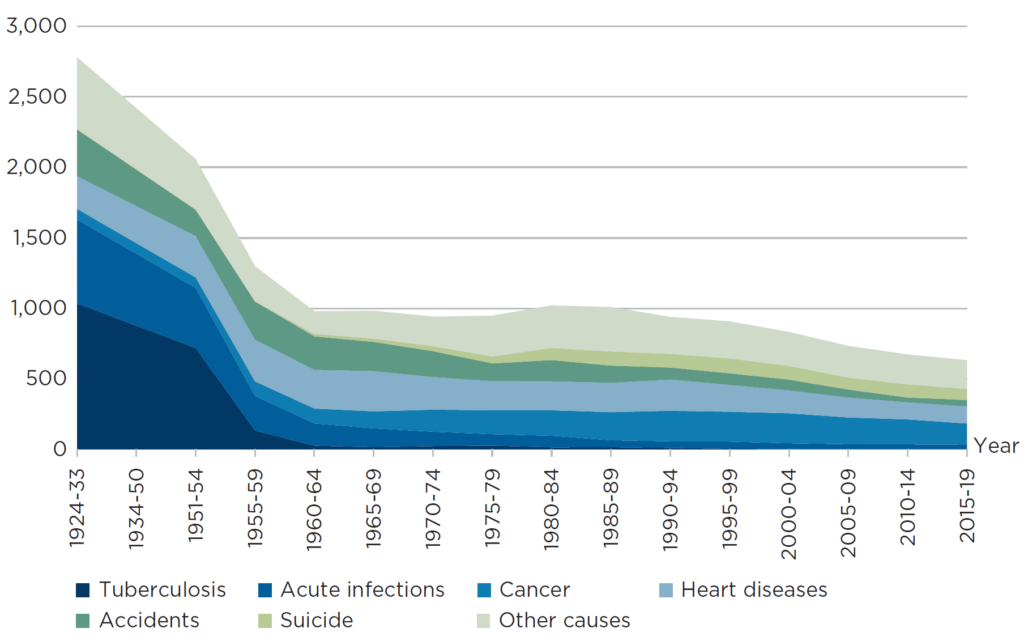
The causes of death among the Greenlandic population in the period 1924 to 2019 cover several stages in the development of Greenland over the past almost 100 years: the beginning transition from hunting to fishing in a largely ‘closed’ Greenland (first decades in the 1900s), the modernisation period in the 1950s and 60s, the period leading up to the introduction of Home Rule in Greenland, the period of Home Rule Government and the beginning of the Self-Government period.
GRØNLANDS STATISTIK – DATABANK/BEXDT5A
The causes of death reflect, in various ways, the developments in technology (both in health sector and the main professions), in political objectives and in lifestyle. One of the factors that has changed significantly throughout these periods is tuberculosis which, until the early 1950s, was epidemic and was a frequent cause of death until the mid-1950s. A focused and multi-pronged health strategy that involved both the establishment of hospitals (sanatoriums) and prioritising housing to replace peat huts and other outmoded housing resulted in the near-eradication of tuberculosis. The development in deaths from other acute infectious diseases other than tuberculosis (e.g. pneumonia) exhibits the same pattern and is, not least, a result of improved living conditions, hygiene and improved housing conditions as well as health care initiatives.
Another cause of death that has been reduced is accidents which through the first part of the period typically involved deaths among men who worked at sea. During the period up to 1960, a gradual transition took place from hunting in kayaks to hunting and fishing in dinghies and larger boats. This also reduced the risk of fatal accidents, but accidents were still a major cause of death until the early 1990s.
At the same time, throughout the period, heart disease/disorders have been a major cause of death, while cancer was a less frequent cause of death at the beginning of the period. However since the mid-1960s death due to cancer has been among the most frequent. Some of the reasons often mentioned, is that several types of cancer are so-called lifestyle diseases.
Suicide used to be a very rarely occurring cause of death, but in the wake of modernisation and, not least, from the early 1980s, suicide rates increased – primarily among young men – and it is one of the major causes of a relatively low average life expectancy among men.
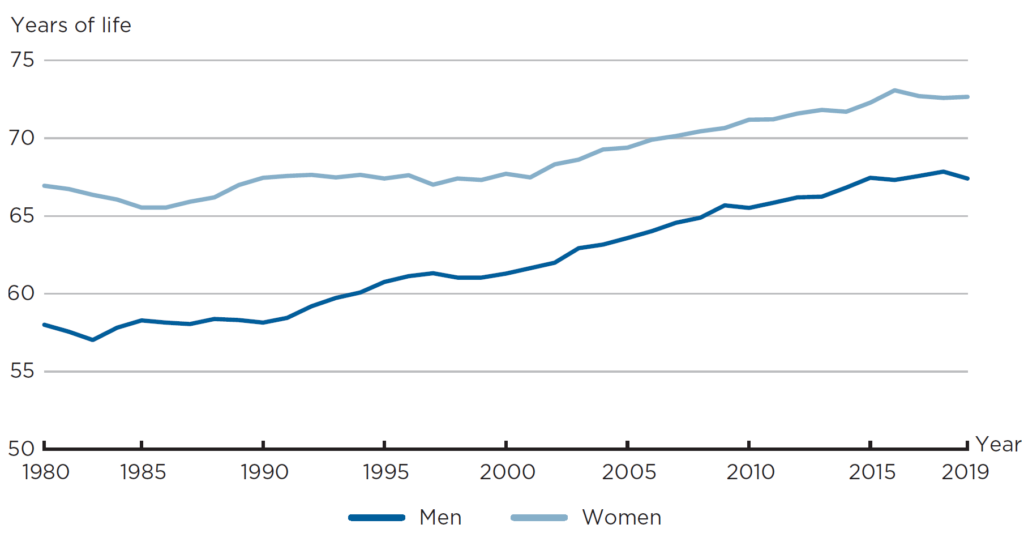
Average life expectancy of the population
In the period 1996 to 2015, women’s average life expectancy increased from 69 years to just under 74 years, while the average life expectancy for men over the same period increased from just over 63 years to 69 years. Key reasons for the shorter life expectancy of men are that, as mentioned, suicides and accidents are frequent among younger men.
Although the average life expectancy of both men and women has increased significantly, it is considerably lower (about 10 years) than in the Nordic countries.
Further reading
- Education
- Hans Egede and the work for the mission service
- Health and care
- Home Rule (1979‑2008)
- Housing
- Hunting and subsistence economy
- Industry and labour market
- Infrastructure
- Peqqineq – Health and balance
- Plans in Greenland
- Self-Government
- The colonial period until the war years
- The five regional municipalities
- The Greenlandic insular community
- The Inuit culture, precolonial period
- The Unity of the Realm and the Danish State
- Towns and settlements
Read more about Society and business in Greenland

