LARS H. OSTENFELDT, 2021
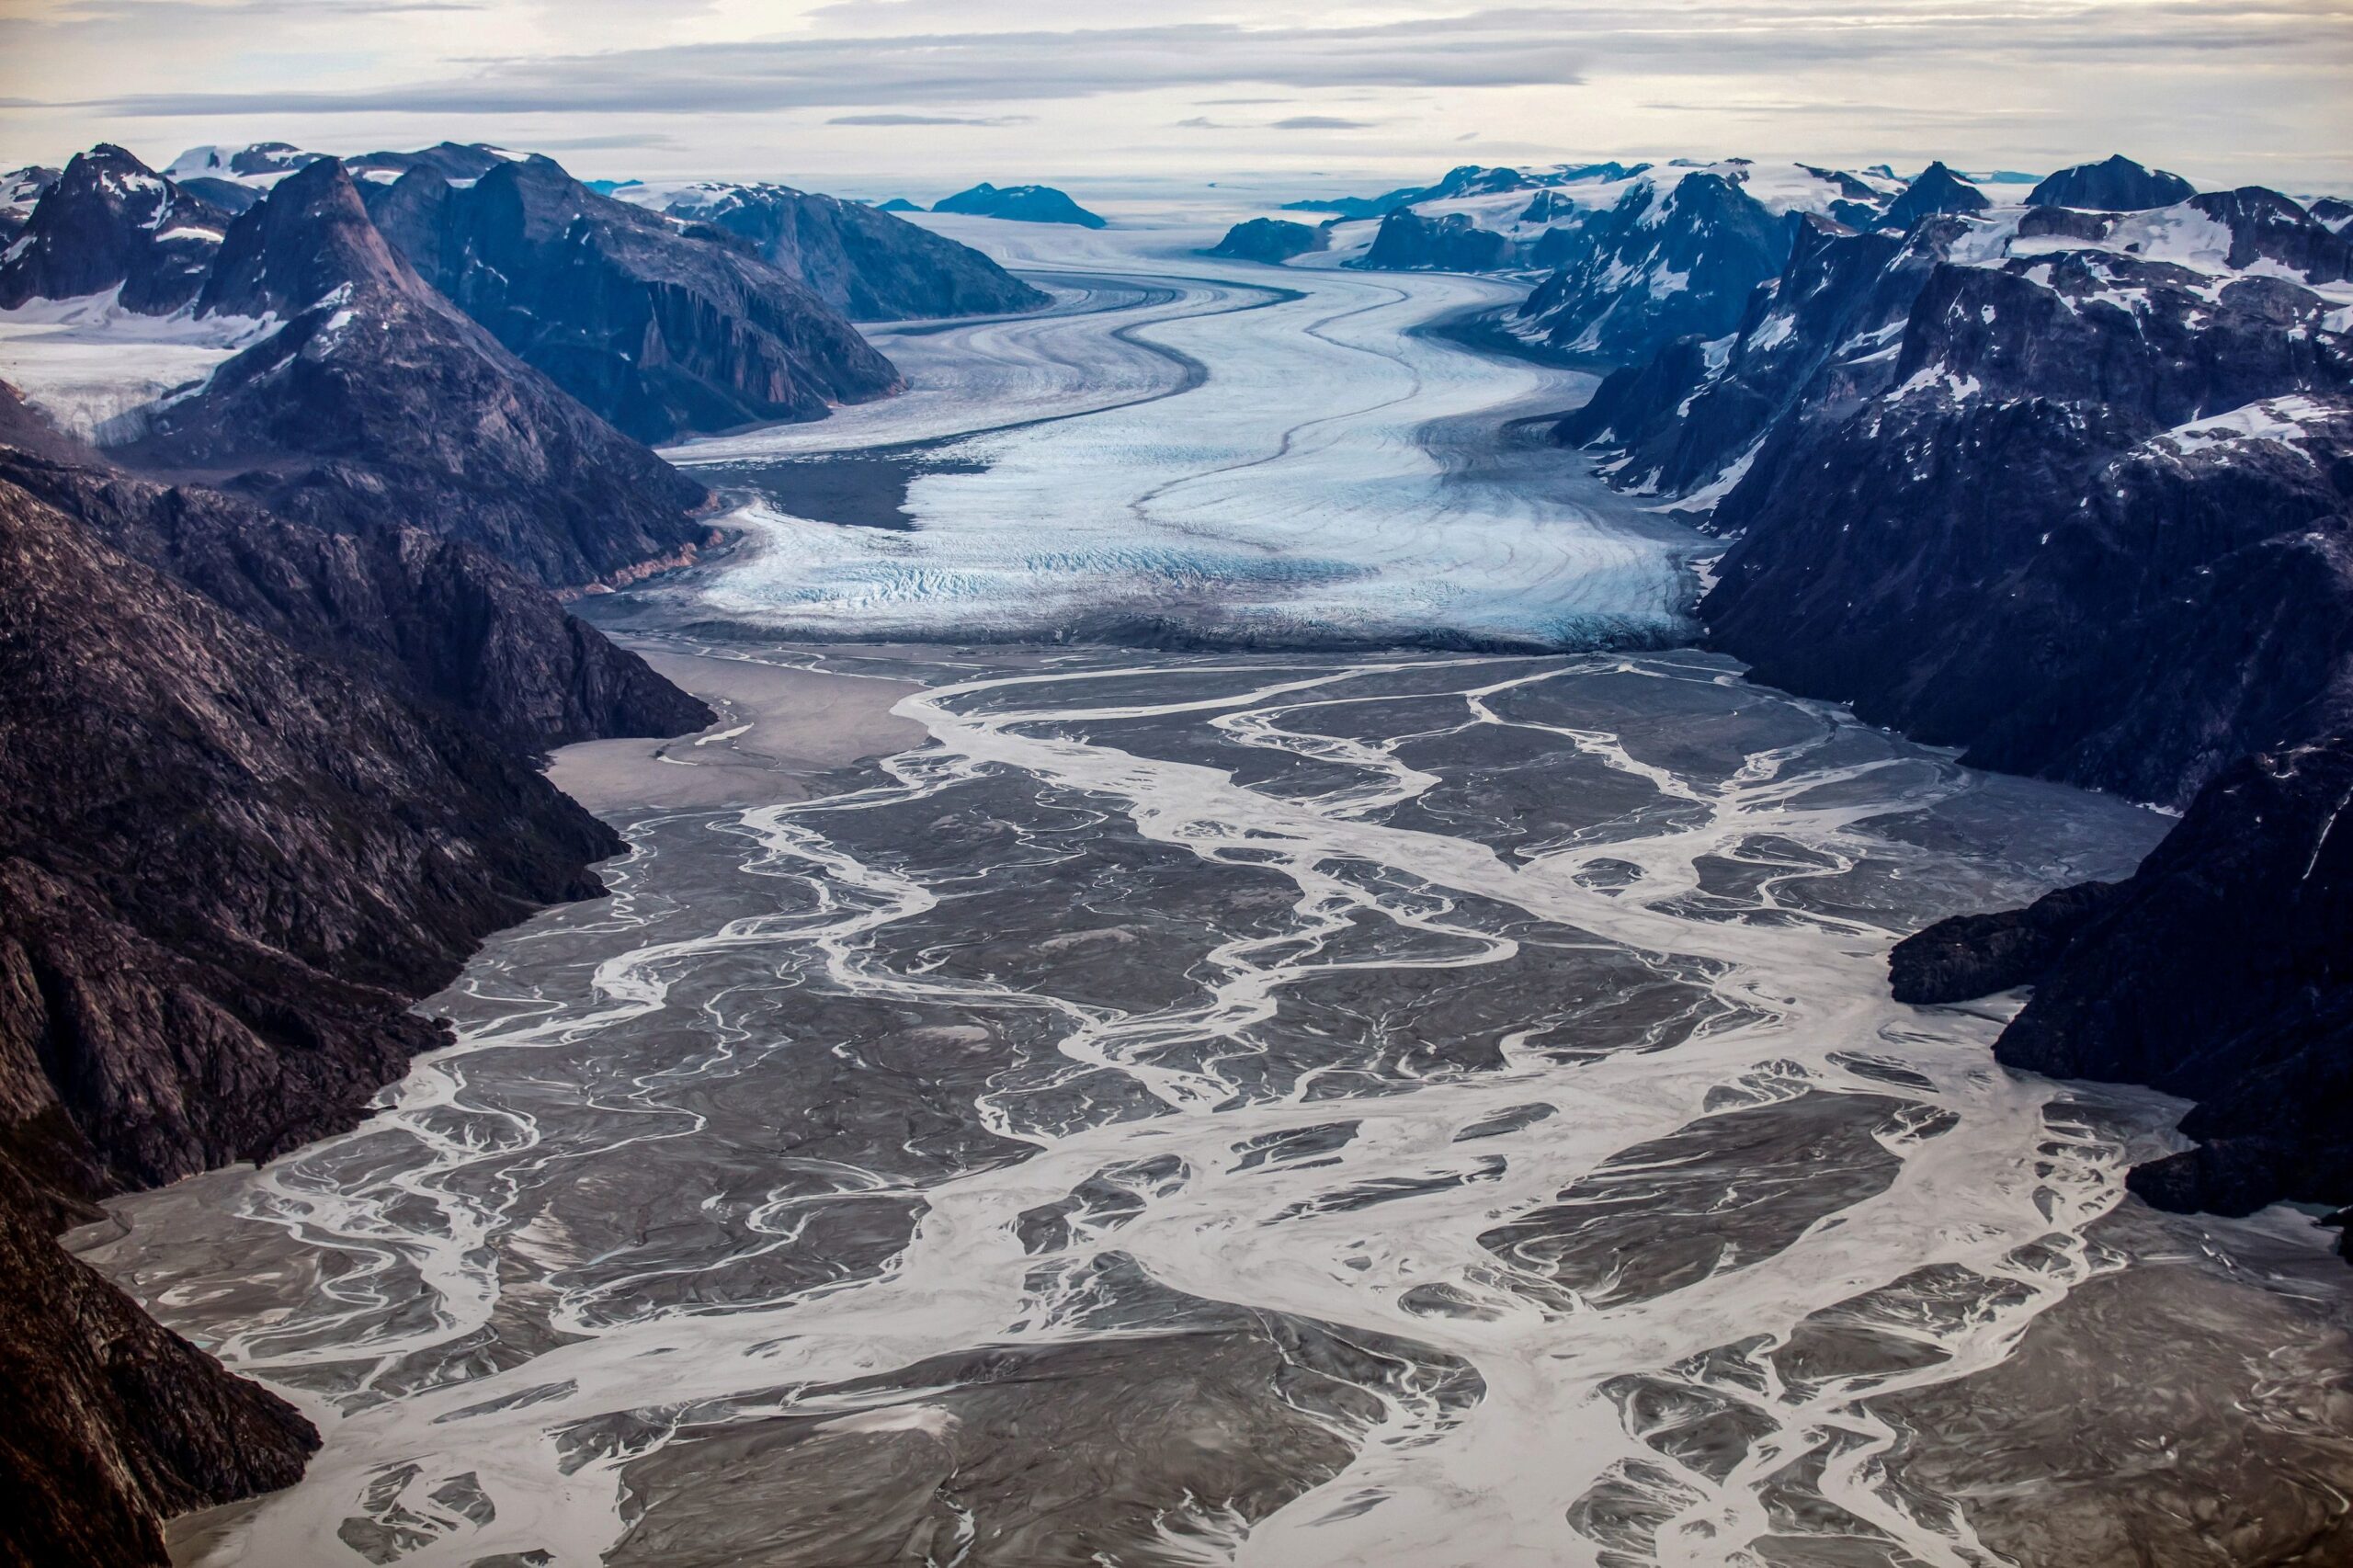
The ice sheet covers 81 % of Greenland and glaciers and ice streams extend to the coast, where icebergs calve and meltwater forms rivers and fills lakes. The ice sheet is the second largest mass of ice on Earth, surpassed only by Antarctica. The volume of the ice is about 3 million km3 and with a mean thickness of 1.8 km. The centre of the ice sheet reaches an elevation of about 3,232 m above the current sea level. If the ice were distributed over Denmark, it would be about 70 km thick. The ice is fresh and is thus also the Earth’s second largest reservoir of frozen fresh water. The volume of the ice corresponds to a global sea water rise of about 7‑8 m. Studies of the bottom material under the ice as well as studies of sediments in the sea around Greenland indicate that there has been ice in Greenland for at least 7 million years. The size of the ice sheet has changed in line with the warm and cold periods of the past, and the current ice cap has covered the country for at least 1 million years. The top of the ice sheet’s surface has been mapped using satellite measurements and the bottom using radar measurements. Such a heavy mass of ice has over time pushed the rock surface by up to a kilometre down in the central parts. Today, the bottom in the central parts is more than 200 m below the current sea level.
The ice sheet means a lot to Greenland and the Earth’s climate. Snow falls on the ice cap and in the central highlands, it is cold all year round, meaning that the snow does not melt in summer. The white areas reflect about 80 % of incoming sunlight and thus have a very high albedo — an expression of the proportion of sunlight reflected from a given surface. This means that the large ice cap helps to keep the Earth cold.
Melting of the ice sheet

HANNIBAL HANSCHKE/REUTERS/RITZAU SCANPIX, 2021
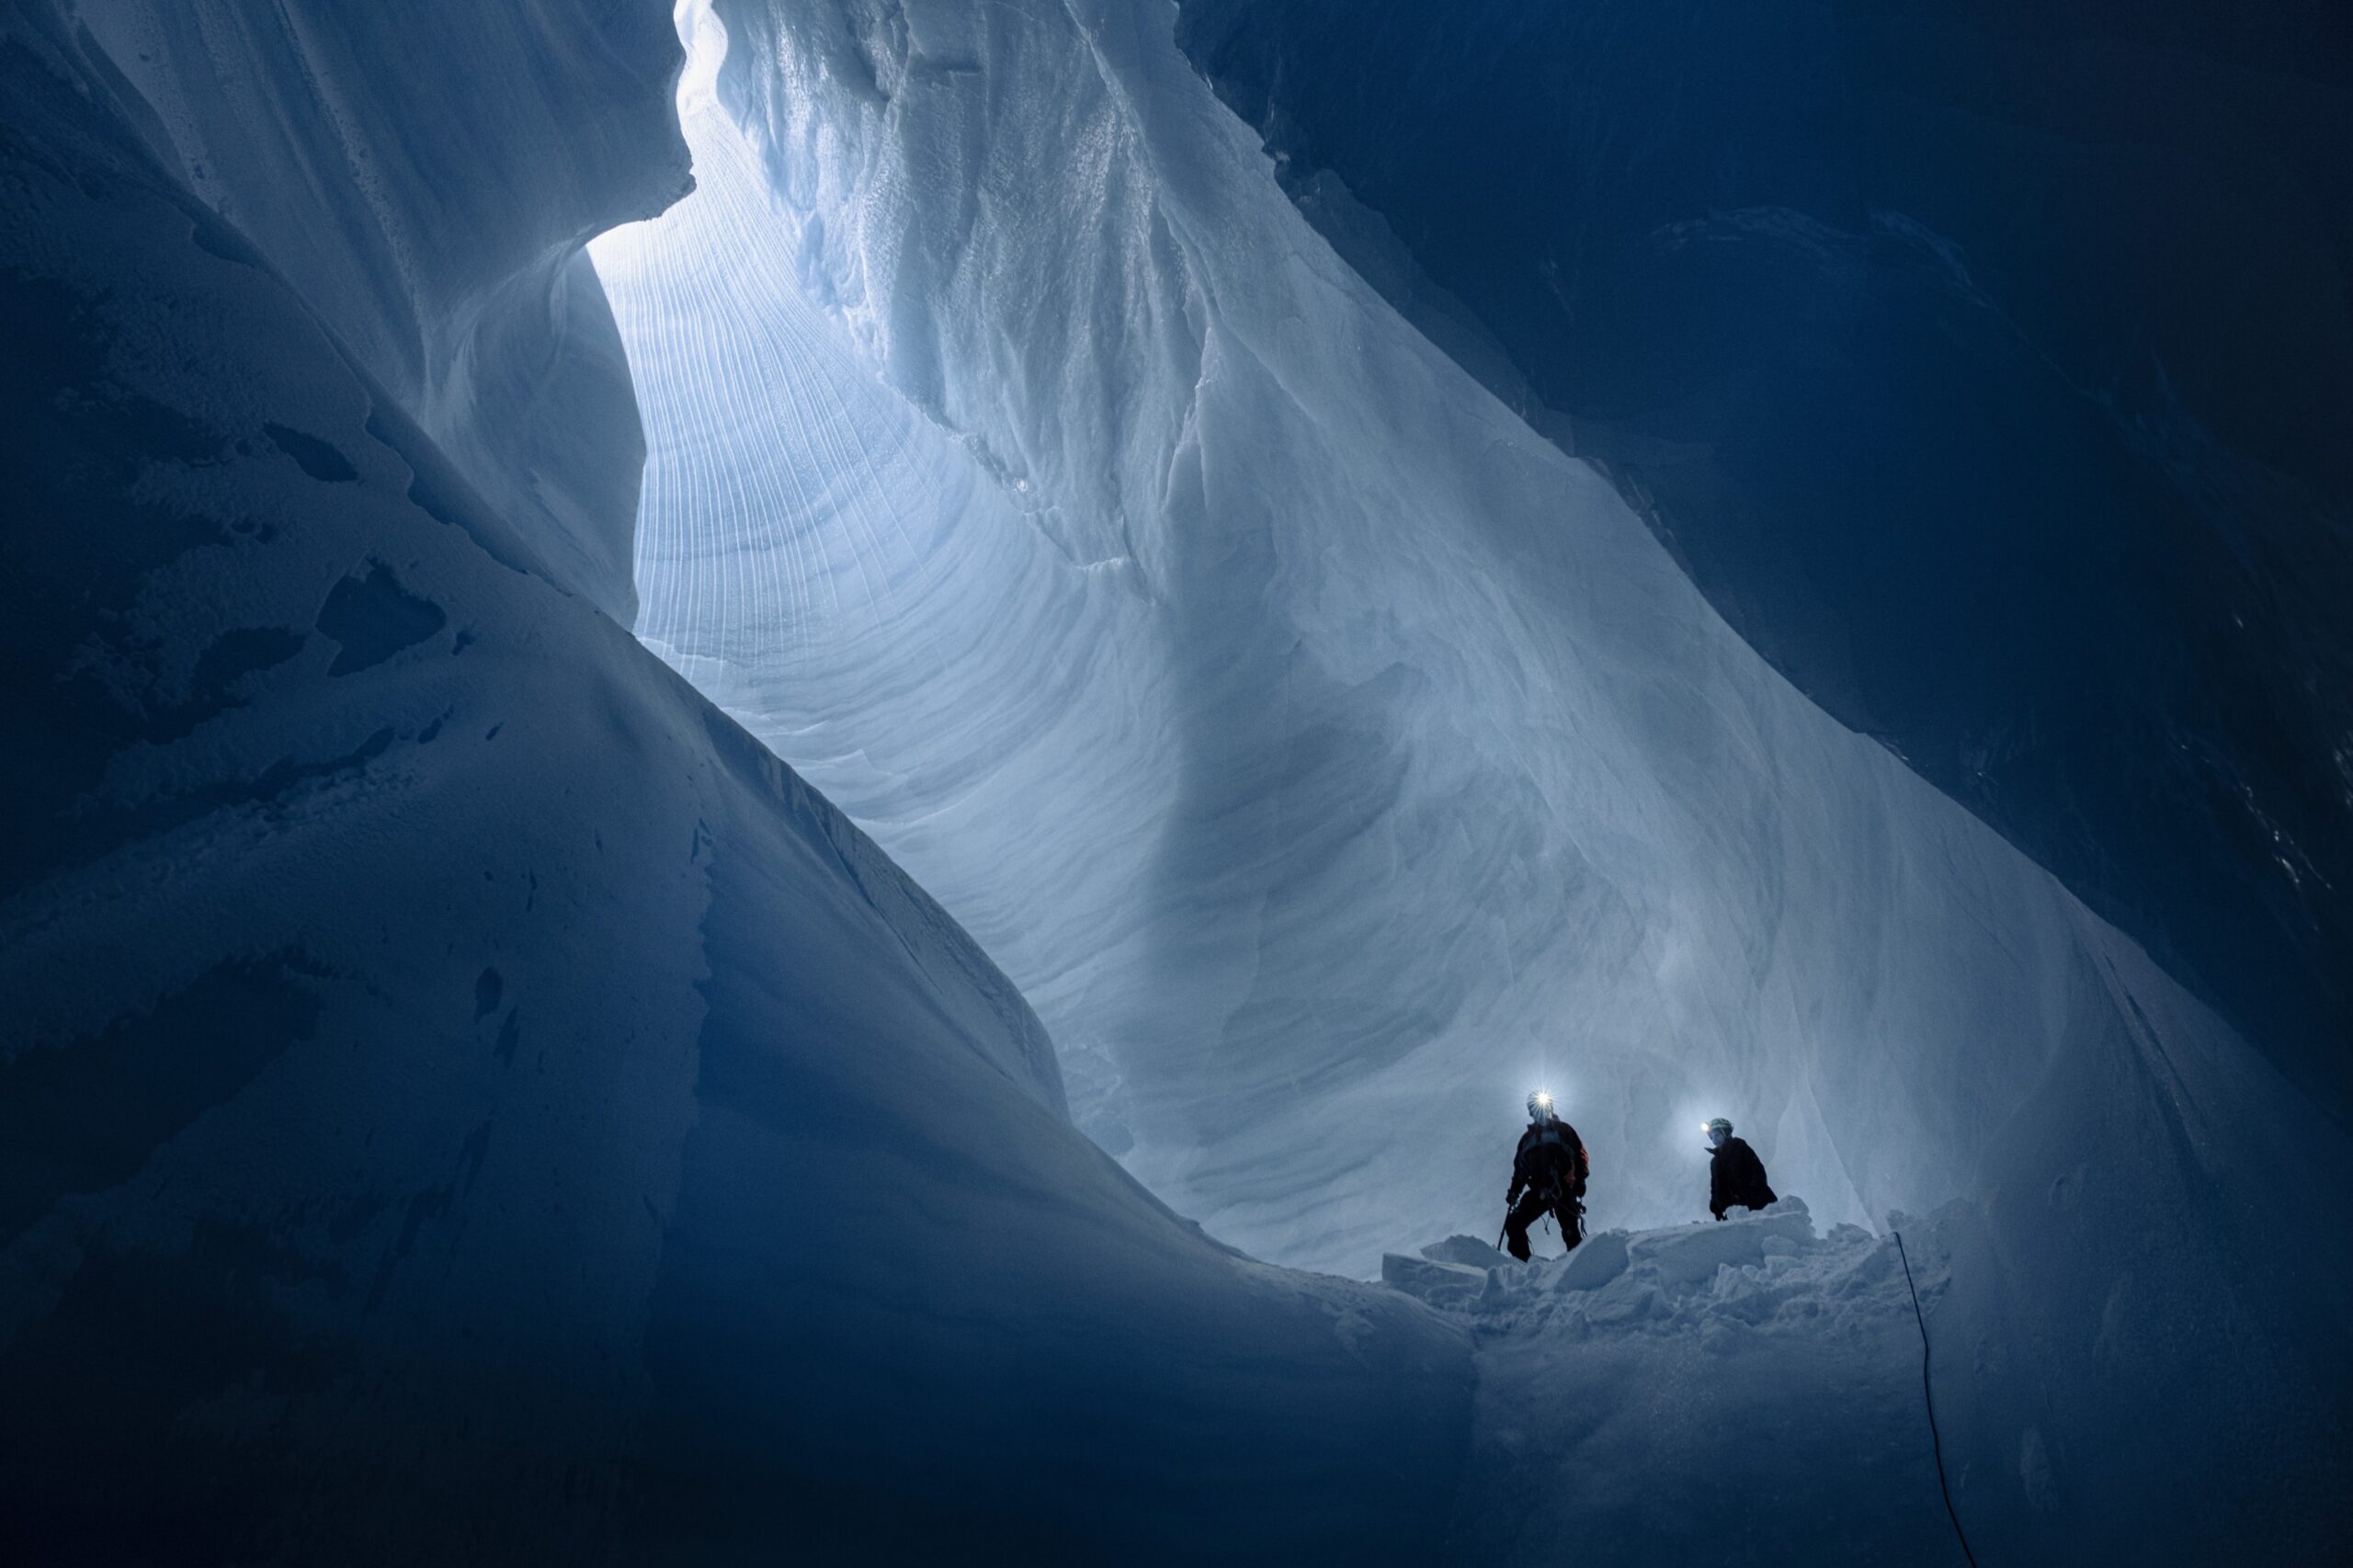
In the lower areas along the edge of the ice sheet, snow and ice melt in summer. In many areas this forms blue meltwater lakes and rivers that drain the meltwater via well-like shafts (moulins) down to the bottom of the ice, where it flows under the ice out to the edge. In the lower areas, the winter snow melts away and the darker ice surface is exposed and melts. It is the natural cycle that ice from the centre of the ice cap flows out toward the edge to melt. The melting surface is much darker than the white snow surface seen in the central parts of the ice cap and this intensifies the melting along the edge.
As the temperature rises, the melting area will reach higher up on the ice sheet in summer and more ice will melt. At the very edge you will also find shafts that occur when the ice floats over the unevenness of the rock surface or increases the speed and is pulled apart. The shafts can typically be 20 m deep and can be difficult to see in winter and spring when covered in fresh snow.
The ice sheet as a resource

LARS H. OSTENFELDT, 2020
The ice sheet is of great importance both regionally and globally; regionally in terms of water supply, fishing and transport, globally in terms of sea level rise.
Meltwater from the ice sheet, which accumulates in lakes, is an important part of the water supply to towns and settlements, and in the big towns, water from rivers and lakes is also used for hydropower. In places where the ice flows into the sea and calves as icebergs, there is a very large supply to the sea of very nutritious fresh water. This means that the neighbouring area is often rich in living resources. The calving icebergs are also important for transport and the possibility of oil extraction from the seabed.
Exploration of the ice sheet
The great ice sheet has been alluring for expeditions all the way back from Fridtjof Nansen, who crossed the ice at the southern end in 1888, Robert Peary in the north in 1892 and Lauge Koch in the middle in 1913.
The first major international scientific expeditions across the ice were the EGIG expedition in the years 1956‑1972. The expeditions were organised by the International Commission on Snow and Ice and had participation from Denmark, Germany, Austria, France and Switzerland. EGIG measured a profile over the ice and made meteorological and glaciological observations. Since then, numerous expeditions have been on the ice sheet to measure the ice, sample ice cores for palaeoclimatic studies and to understand the dynamics and melting of the ice. Satellite observations of changes in elevation, surface temperature and ice flow have since 1979 revolutionised the knowledge we have about the ice sheet.
Recent climate research on the ice sheet
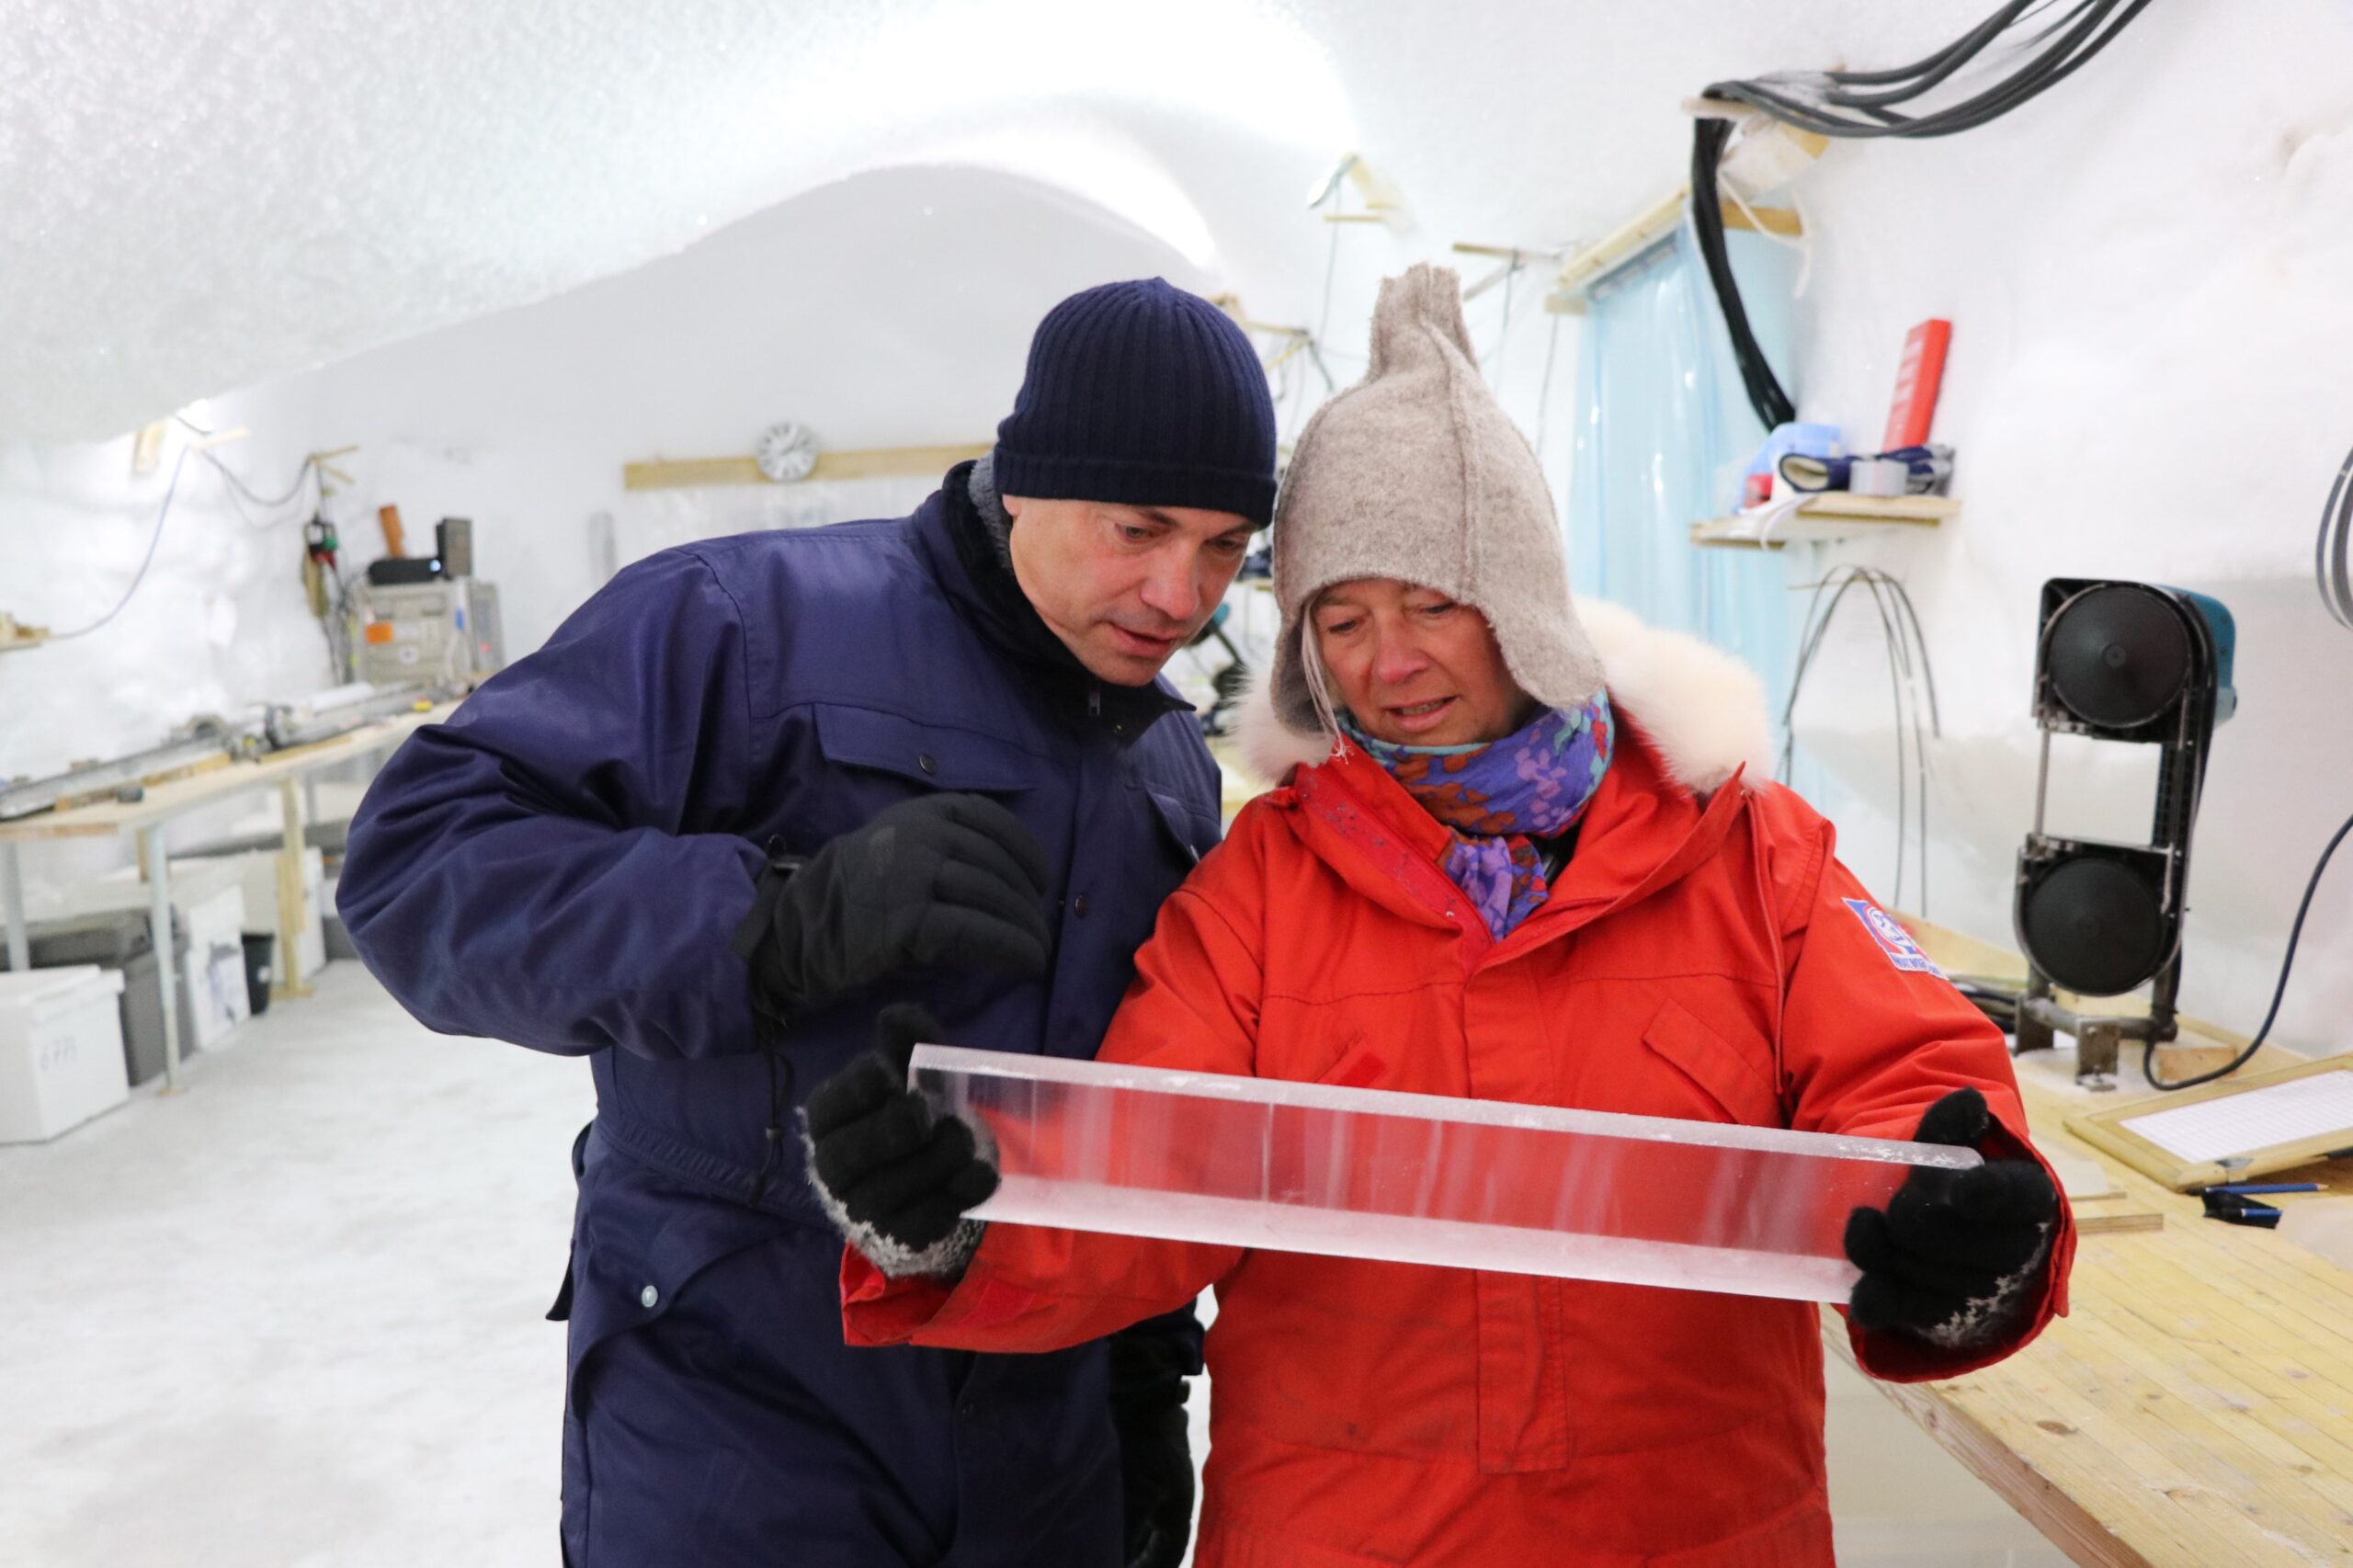
The ice sheet contains important information about the climate of the past. Every year, snow falls on the ice. The annual layers of snow are slowly compressed into ice and sink into the ice cap, thus the ice consists of horizontal annual layers. The ice sheet is in constant motion, and it takes an average of 10,000 years from a snowflake lands on the central parts of the ice sheet until the snow has turned to ice and has flowed with the ice out to the edge to melt or been carried further out to the sea as an iceberg. At the bottom, the ice is up to 1 million years old, but the lower ice is so compressed and mixed that it has not so far been found in stratigraphic order older than 130,000 years back in time.
The ice sheet is a unique source of information about the climate of the past, not least due to the long climate series and the high temporal resolution.
Scientific exploration in a historical perspective

UDDANNELSES- OG FORSKNINGSMINISTERIET, 2018
With the colonisation of Greenland in the early 18th century, knowledge about the country’s people and nature started being collected. The missionary Hans Egede became the first storyteller with the publication of The New Perlustration of Greenland or Natural History in 1741, which is considered to be the first real physical geography and ethnographic documentation of living conditions in Greenland. The pioneer in the field of fauna was the missionary Otto Fabricius, who in 1780 published Fauna Groenlandica.
The first to carry out a systematic study of the minerals was the German geologist Karl Ludwig Giesecke, whose work was continued by the geologist Hinrich Johannes Rink. The geology has been supplemented with zoological and botanical studies, and the mapping of the country has continued using modern aids. Aerial photography was used for the first time during Lauge Koch’s expeditions from the 1920s to the 1940s. Since 1946, the geological surveys have been organised by the Geological Survey of Greenland (which later became part of the Geological Survey of Denmark and Greenland).
Studies of the sea and marine wildlife have been carried out since 1879 and have been crucial to fishing becoming a main industry. Since 1946, this research has been organised in the Greenland Fisheries Survey, which in 1995 became part of the Greenland Institute of Natural Resources.
To support scientific research in Greenland, the Danish government set up the Commission for the Management of the Geological and Geographical Surveys in Greenland in 1878, which was replaced in 1931 by the Commission for Scientific Investigations in Greenland. Since 1879, these organisations have published the monumental work Monographs on Greenland, in which results of research in all disciplines have been published.
In collaboration with the Home Rule Government at that time, the Danish Polar Centre, established in 1989, served as secretariat and co-coordinator for the scientific studies in Greenland, until the centre was closed in 1988.
Since the end of the 19th century, systematic meteorological observations have been made in Greenland, which are of great importance for climate research and for European weather forecasts. The drill cores from the ice sheet, which have been retrieved since 1980, have been groundbreaking for the international understanding of past climate fluctuations.
Ice core drilling
By drilling a 3 km long ice core in the central part of Greenland, the climate can be mapped with annual precision. One can i.a. see that the climate has changed between glacials and interglacials.
During the previous interglacial, the Eemian interglacial 115,000 to 130,000 years ago, it was 5ºC warmer in Greenland than now, and there was still a lot of ice. Based on measurements of the old ice and the fact that all the ice cores drilled in both South and North Greenland contained ice from the Eemian interglacial, it is estimated that the ice cap was 20 % smaller during the warm Eemian period than now.
During the glacial period, there were 25 events of 1,000 to 3,000 years’ duration where the temperature over Greenland, over a period of 100 years, suddenly rose by 7ºC to 15ºC and then slowly fell again. Climate reconstructions show that there has been a changing climate back in time. However, measurements of greenhouse gases in the entrapped air bubbles in the ice show that there have been no periods where the concentration of carbon dioxide has exceeded 300 ppm and thus not even close to the concentrations of over 400 ppm seen in recent times.
Global warming and sea level rise
There is significant focus on the impact of the ice sheet and the surrounding smaller ice caps and glaciers on the global sea level rise. The warming over the ice sheet is 2‑3 times the global warming, which gives rise to massive melting. The melting from the ice sheet comes both from melting along the edge of the ice and from calving icebergs from the many fast-flowing ice streams around Greenland. Since the year 2000, the mass loss from the ice sheet has increased, and in the period 2010 to 2020, the ice sheet has lost an average of 240±60 km3 of ice annually, corresponding to a global sea mirror rise of 0.7 mm per year.
Forecasts for the mass loss from the ice sheet are very uncertain, particularly because it is difficult to predict the development of ice streams. The ice streams flow faster than the surrounding ice and calve icebergs into the fjords. Sermeq Kujalleq (formerly known as Jakobshavn Glacier) is the best known with speeds up to 14 km per year. In recent times, the speed of the ice stream has increased from 7 to 14 km per year, but most recently dropped to around 10 km per year, although it continues to get warmer over the ice sheet.
The many hundreds of ice streams around Greenland have almost all increased their speed, thereby giving off more ice to the sea. Researchers have a large network of observation stations for monitoring the melting from Greenland, which is seen as one of the largest sources of increased global sea level rise in the future.
Further reading
- Agriculture in Greenland
- Biodiversity and nature management
- Coasts
- Geology in Greenland
- Release of the musk oxen
- Seasonal pollution in Northeast Greenland
- Systematic environmental monitoring
- The climate in Greenland
- The fresh waters
- The highly diverse bottom fauna
- The ice-free landscapes
- The National Park in north and east Greenland
- The polar bear
- The sea and the fjords
- World heritage: Aasivissuit – Nipisat
Read more about Nature and landscape in Greenland

